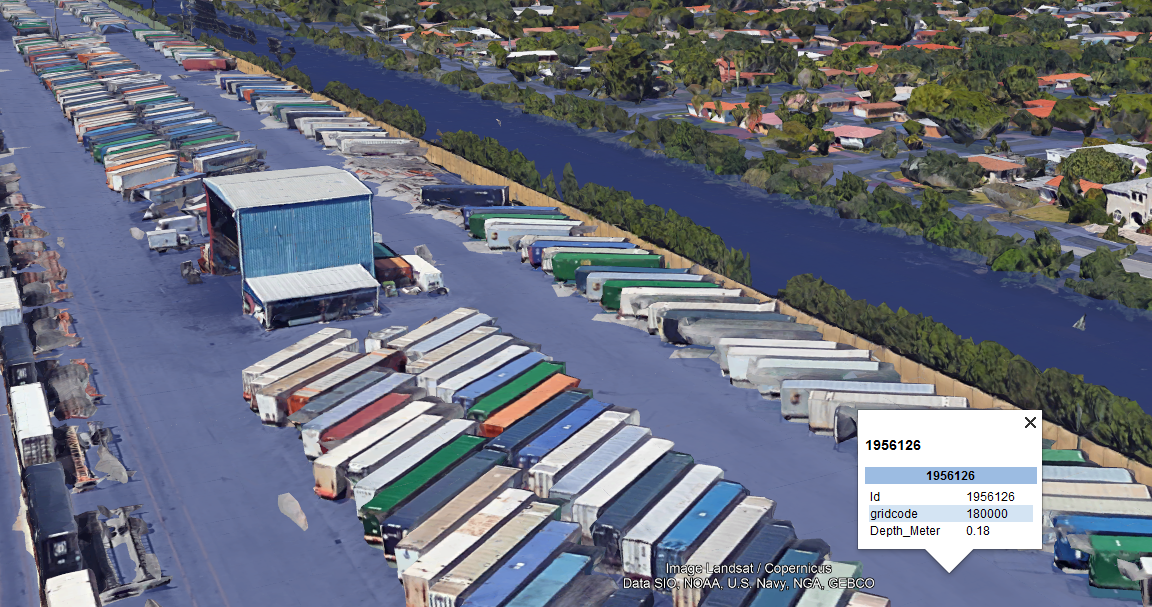
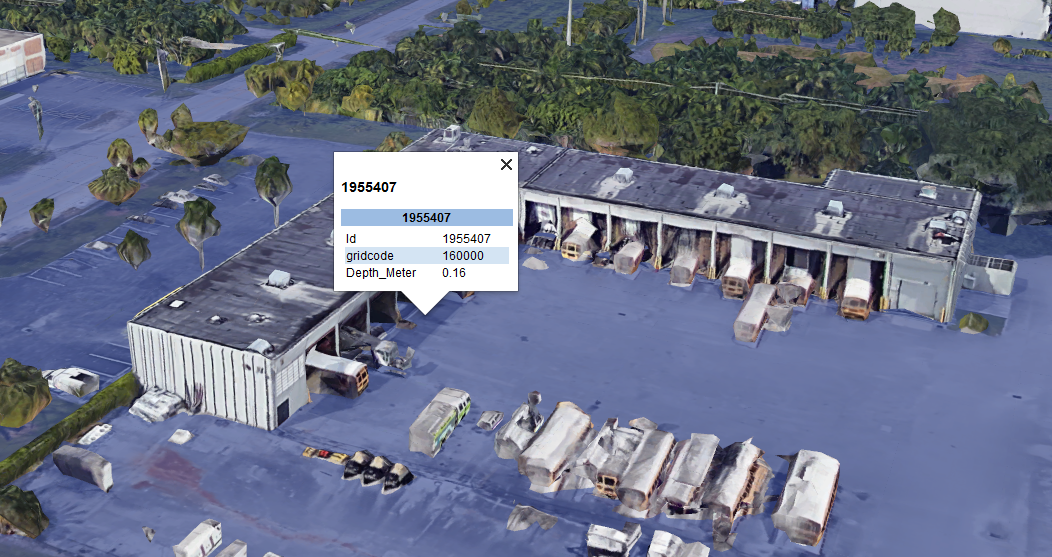
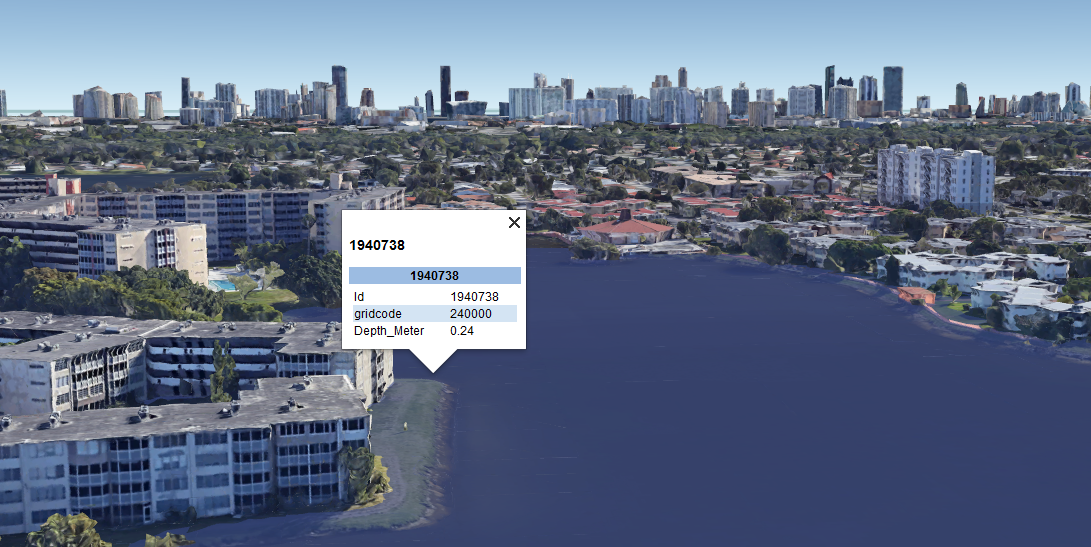
Two of the top three most deadly natural disasters since 1900 were due to flooding [1]. Approximately 80 people lose their lives to flooding each year in the US [2]. Flood risk mitigation is most effective when walking hand in hand with correct science, effective regulation, and public buy-in. As discussed in our previous article and demonstrated in these visualizations, Google Earth Flooding and 3D Printed Flooding are effective tools for accelerating public buy-in to flood mitigation programs. The methodology presented herein provides a snapshot of short-term flood predictions in a striking, intuitive, and relatable manner. This method is novel in that we are predicting the immediate future rather than the regulatory future (100-year floodplain). See the slideshow below showcasing a 10 day forecast of flooding in Florida (these results are approximate).


Let’s consider a situation where a township has not properly prepared for a flooding event that will occur in a few days time. How can they effectively predict this event? And assuming they can predict this event, which areas should they evacuate and by what time? The answer to these two questions lies in the National Water Model. And if proper Data Science techniques are employed, the aforementioned questions can be answered for every village, township, and city across the U.S. The object of this post is to 1. briefly introduce the predictive power of the National Water Model and 2. describe a methodology to notify townships of where they should focus their evacuation efforts in the days leading up to a major flooding event.
An Introduction to the National Water Model
The National Water Model (NWM) is a streamflow forecasting behemoth. In the past, the U.S. was obligated to predict streamflow at a few thousand metered locations. With the NWM online, the National Weather Service is now able to forecast streamflow at over 1 million metered and unmetered sites. Forecasts range from 1.5 to 30 days. Check out the following graphic for a mesmerizing demonstration of what the NWM does.
In addition to the production of streamflow forecasts and stupendous visuals, the NWM also outputs ponded depth grids that are 250m by 250m. Although approximate, these ponded depth grids can inform evacuation efforts at a high-level. Unfortunately, this dataset is not available for viewing on the NWM interactive map or image viewer. To my knowledge, these ponded depth grids are not being utilized in flood planning or evacuation efforts. The following methodology provides a pathway to achieve these goals.
Methodology to Save ‘Township A’ from Loss of Life
Townships across the US can be saved from loss of life by 1. continuously tracking ponding depth indicators, 2. notifying townships of imminent flooding, and 3. through the provision of intuitive flood visualization resources. These steps are described separately, but if you are for a more thorough overview, I suggest watching the following video that summarizes the process.
Continuously Tracking Ponding Depth Indicators
A nationwide ponding depth raster dataset is available for download here. Once downloaded, the NetCDF file format needs to be converted into a standard raster file format. For this prototype, I convert the file to a .TIF raster. Zonal statistics was then performed on the raster using a nationwide populated places shapefile. This produced a table specifying the average, mean, max, min, etc. of the ponding depth raster for every populated place. Example output can be found here. This process would be repeated over time. Ponding depth indicators would be tracked and thresholds developed for a given location. For instance, these indicator thresholds could be 3 standard deviations from the annual mean ponding depth for a given location.
Notifying Townships of Imminent Flooding
If the ponding depth indicator threshold is surpassed for a given location, an email will be generated and sent to that location. This email will specify that “The National Water Model predicted that in 10 days your city is scheduled to receive major flooding. The extent and severity of flooding can be explored by downloading and exploring the following KML in google earth.”
Provision of Intuitive Flood Visualization Resources
Each city with extreme flood forecasts would be provided a depth of ponding KML. These KML’s can be opened on a desktop, browser, or phone. City planners and emergency response personnel can explore the KML to decide where to focus their pre-flood activities. These activities could include knocking on doors to notify residents, or sandbagging sections of the riverbank to prevent flooding.
Conclusion
As shown in this post, it is possible to leverage data from the National Water Model for flood risk forecasting. By notifying cities of intense flood forecasts, and providing them with an intuitive flood visualization resource, city planners and emergency responders can act proactively rather than reactively.

Leave a comment